|
Oregon Outlook
Spring 2007
26 to 5
Oregon’s residential real estate market has been on a roller coaster ride in recent years. Calendar year 2003 saw Oregon homes rank 26th of the 50 states in average price appreciation, with a modest 6.43% rise.
Step forward three years. Oregon’s average home price appreciation of 13.49% during 2006 ranked #5 in the nation. Utah led the states with an average rise of 17.55% in 2006 after ranking dead last in 2003. By comparison, the average U.S. home value rose 5.87% during 2006, with dozens of housing markets around the nation seeing modest price declines.
The source of the data, the Office of Federal Housing Enterprise Oversight (OFHEO), is considered an accurate indicator of home prices. The data measures repeat sales and refinancings of millions of homes since 1975 in more than 375 communities.
While many homeowners and the media focus on the latest 12-month data, a five-year measure of price changes is also of value. The average American home value rose 55.21% between 2001 and 2006. By comparison, the average Oregon home value rose 68.91%.
Top Ranked
Various Oregon communities saw solid home price gains in 2006, with Bend leading the nation with a 21.39% rise (and a five-year appreciation rate of 104.45%). Corvalis ranked 8th in the nation, with a 16.18% one-year average home price rise and 52.48% over five years.
Salem (15th best) saw home prices rise 14.73% and 50.97%, respectively. Portland-Vancouver-Beaverton (22nd best) recorded average home value gains of 13.45% and 66.86%, while Eugene-Springfield saw prices rise 11.38% and 65.51%. Medford’s average home value cooled to a 3.45% rise in 2006, but a steamy 90.08% rise over the past five years.
Another major measure of home values—calculated by the National Association of Realtors—noted the median (half cost less, half cost more) existing American home value declined by 2.7% to $219,300 in 2006. The Portland-Vancouver-Beaverton median home value rose 11.2% to $285,400. The Eugene-Springfield median home value rose 10.5% to $230,900, while the median Salem home value rose 14.9% to $223,100. 
Oregon home values are likely to rise at lesser rates over the balance of 2007 and into 2008. A housing bubble? It appears to be deflating in many coastal markets and in the Southwest (see pages 3-4 for more detail).
Tighter
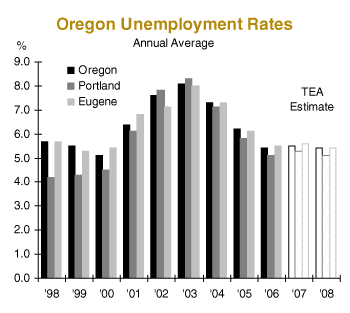
Strong Oregon job creation of the past three years has contributed to a tightening of the state’s labor market. The Oregon unemployment rate averaged 5.4% in 2006 before moving slightly lower in 2007’s first few months.
With the exception of a 5.1% average unemployment rate in 2000, one has to go back to 1995 to find a jobless rate as low as the 5.4% average last year. Even as the state’s jobless rate has fallen sharply, current rates in the low-to-mid 5s still rank among the ten highest in the nation.
Many Oregon companies note their frustrations in filling open positions and retaining key employees. Such concerns are most prominent in the small business sector, where many firms cannot offer wage levels and benefit packages to match those of larger employers. However, those firms willing to pay higher wages, as well as firms that enjoy solid reputations as employers, are having many fewer labor availability problems.
 Best in 10 Best in 10
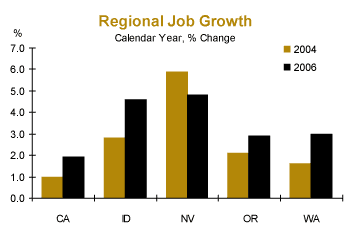
Net job gains of just under 50,000 annually in both 2005 (a 3.0% rise) and 2006 (a 2.9% rise) were the strongest of the past 10 years. However, annualized Oregon job growth rates have slowed over the past few months, tied in part to more moderate U.S. economic growth.
Employment additions over the most recent 12-month period were led by the trade, transportation & utilities; leisure & hospitality; professional & business services; education & health services; and government sectors. The construction and information sectors had fewer job additions, while the manufacturing and natural resources & mining sectors both saw employment declines. We expect the state’s employment sector to grow at a 2.0%-2.4% annual rate during both 2007 and 2008.
|
