|
May 9, 2007
88K
Written by Jeff Thredgold, CSP, President, Thredgold Economic Associates
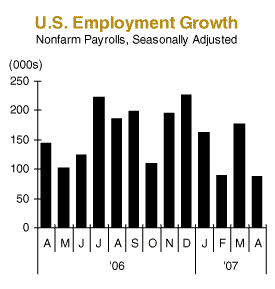
American employment growth was modest in April, with the 88,000 net increase the weakest gain in nearly two-and-a-half years. The underwhelming rise was just below economists’ consensus view of a net rise near 100,000 new jobs. And in a departure from that of more recent months, employment gains of the two prior months were revised lower—not higher—in this case by 26,000 jobs.
Lost & Found
Goods-producing employment declined in April, with a net loss of 28,000 jobs. Construction employment declined by 11,000 jobs in April, while manufacturing employment fell by 19,000 positions.
Service-providing employment led the way in April with a rise of 116,000 net new jobs, although the overall services gain was the smallest in nearly a year. The education & health services sector added 53,000 positions. Government added 25,000 net new jobs in April, while the professional & business services sector added 24,000 jobs. 
The leisure & hospitality sector added 22,000 jobs, while the retail trade sector lost 26,000 jobs. Financial services firms trimmed 11,000 jobs in April, suggesting job eliminations in part tied to real estate lending.
The U.S. economy added an average of 129,000 net new jobs monthly in 2007’s first four months, down 43% from the 225,000 average pace of 2006’s first four months. The 2.26 million rise in net new jobs in 2006 roughly matched gains averaging 2.30 million jobs annually in 2004 and 2005.
Good & Bad
The average hourly wage rose 0.2% (four cents) to $17.25 hourly, a rise of 3.7% over the past 12 months, and the smallest gain of the past year. Like most data within the economy, what is good news for one is bad news for another. The 3.7% rise was down from recent year-over-year gains at or slightly above 4.0%, not such good news for wage earners.
However, the more moderate 3.7% hourly wage rise was good news for Federal Reserve officials who are paranoid about inflation pressures in the economy (it’s in their job descriptions). Still, from a consumer’s perspective, the 3.7% rise was substantially above the smaller rise in consumer prices over the same period.
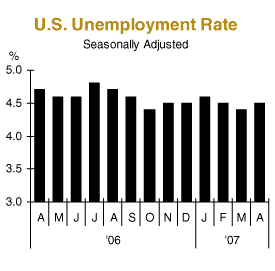
The nation’s unemployment rate rose, as expected, from a near six-year low of 4.4% in March to 4.5% in April. The nation’s jobless rate averaged 4.6% in 2006 and has averaged 4.5% in 2007. Recent jobless rates are also below average jobless rates during the 1970s, the 1980s, and the 1990s.
Large & Small
We have consistently pointed out the difference in U.S. employment gains in recent years when comparing the two primary surveys. The “official” employment data derived from a monthly survey of roughly 375,000 medium and large employers reported the 88,000 net rise in April as discussed above.
The monthly survey of 60,000 U.S. households, from which the nation’s unemployment rate is derived, has typically reported job gains running roughly 40% stronger over the past five years. We have explained this difference as job gains tied to the creation and expansion of American small businesses…jobs that are simply missed in the “official” measure.
We have also noted that the two surveys ultimately move much closer together as more complete information is available, tied to expanded information gathering or modifications to prior estimates. Such was the case in April.
The rise in the nation’s unemployment rate in April was tied to sharp declines in both the estimated labor force and employment as measured in the household survey. The labor force was estimated to have contracted by 392,000 persons in April (to 152,587,000), the largest decline in nearly four years. Those counted as employed fell by 468,000 persons (to 145,786,000), the largest monthly decline since November 2002. The number of people counted as unemployed rose by 77,000 to 6,801,000.
Up & Down
The jobless rate for adult men remained at 4.0%, while the rate for women was also unchanged at 3.8%. The jobless rate for Whites rose from 3.8% to 3.9%, while the rate for Black or African American workers declined 0.1% to 8.2%. The jobless rate for those of Hispanic or Latino ethnicity rose from 5.1% to 5.4%. The jobless rate for teenagers rose sharply from 14.5% to 15.3%, not a good sign as summer approaches.
Maybe & Maybe Not
So what does the employment data imply in regard to monetary policy from the Federal Reserve? Overall weakness in the April employment report can be combined with weak housing market data of the past 12-18 months.
Housing weakness includes overall declines in new and existing home sales, as well as price weakness in various coastal and Southwestern communities tied to prior excesses. Rising delinquencies and foreclosures around the nation associated with sub-prime lenders and strapped borrowers are also center stage. The nation’s “Big 3” automakers are also struggling with weak sales activity.
Weaker job creation, auto sales softness, and housing pain support the view that the Federal Reserve should and will be willing to reduce their key short-term interest rate in coming months, perhaps in early August or mid-September. Moderation in the primary year-over-year inflation measure in recent weeks also supports this conclusion.
At the same time, however, inflation pressures still exceed the Fed’s unofficial 1.0%-2.0% target range. In addition, recent economic surveys regarding the nation’s factory sector and services sector both came in stronger than expected. New jobless claims also dipped sharply in late April, suggesting some improvement in hiring. The vocal minority of economists who still forecast additional Fed tightening later this year espouse these recent numbers.
A weaker U.S. dollar, primarily versus the euro and the British pound, also boosts the Fed’s inflation anxiety as far as more expensive (inflationary) goods coming to the U.S. from those corners of the world. The Fed also sees a powerful American stock market establishing one new high after another, tied to the market’s collective view that the American economy is just fine. Add in a powerful global economy and the Fed can also justify doing absolutely nothing in coming months, a continuation of the position the Fed has occupied since June 2006.
We lean toward the first view, recognizing that all three scenarios are viable.
Differing views are what make a horse race…stay tuned

“Tea”ser
He was a bold man who first ate an oyster.
Send us a “Tea”ser of your own.

“Tea”stimonial
“We very much enjoyed having you again as our keynote speaker at the MAATS Innovation Awards luncheon. Our audience was a diverse one in every sense of the word, and you successfully managed to captivate one and all. You have a wonderful style, and feedback to date has been nothing short of excellent!”
—Thomas J. Dammrich, President, National Marine Manufacturers Association
More testimonials
Do you have a “Tea”stimonial you would like to share with other Tea Leaf readers? Send us an e-mail.
Invite Jeff Thredgold to speak at your next conference, meeting, or client function
If you like the Tea Leaf, you’ll love Jeff Thredgold’s live presentations. Jeff takes your audience on a timely, engaging, and entertaining tour of the U.S. economy and financial markets. Debunking some of today’s most common economic myths, he offers a clear picture of how the American economy is really performing and what that means for the future of your finances.
|
